
A small web server we run had a seemingly high number of requests for the xmlrpc.php WordPress file. There are a class of security issues that arise and the volume and velocity of these requests as we found in some New Relic charts we put together to troubleshoot indicated it was not human engagement.
We were able to see a pattern in the logs and then took a look to see how the requests broke down over our hosted sites using this NRQL query. New Relic’s documentation for NRQL is pretty good. That, accompanied by the autocomplete feature and browsing SELECT * queries, got us where we needed to go.
FROM Transaction SELECT count(*) WHERE request.uri LIKE '%xmlrpc.php%' LIMIT MAX FACET request.headers.host SINCE 6 hours ago
In our case, we did have a site that was receiving about 70% of the xmlrpc.php snooping. You may recall that in our recent post, 03.1 only allow Cloudflare IPs, the server only allows incoming traffic from Cloudflare. This gives us the option to have Cloudflare, and not our server, devote resources to blocking requests we don’t want. The only downside is, at least with the plan we’re on with Cloudflare, you have to set these on a per domain basis. Let me know if you know of a way to create account level firewall rules and not simply at the domain level.
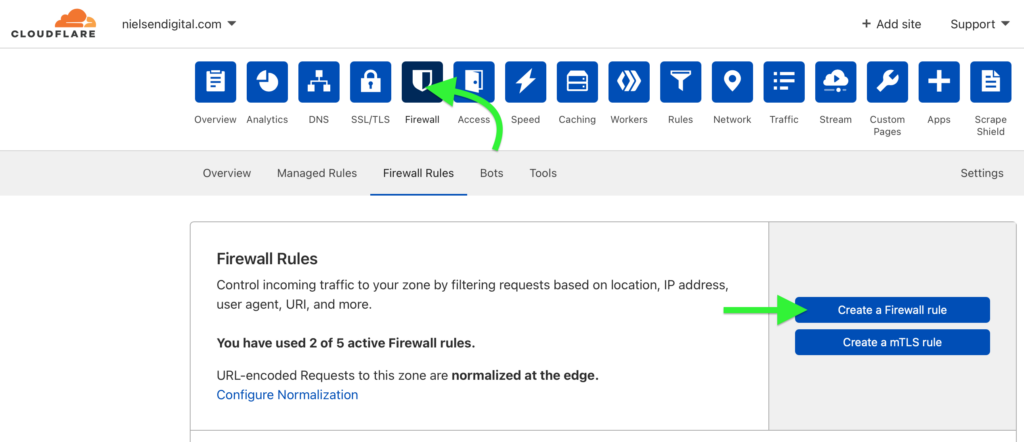
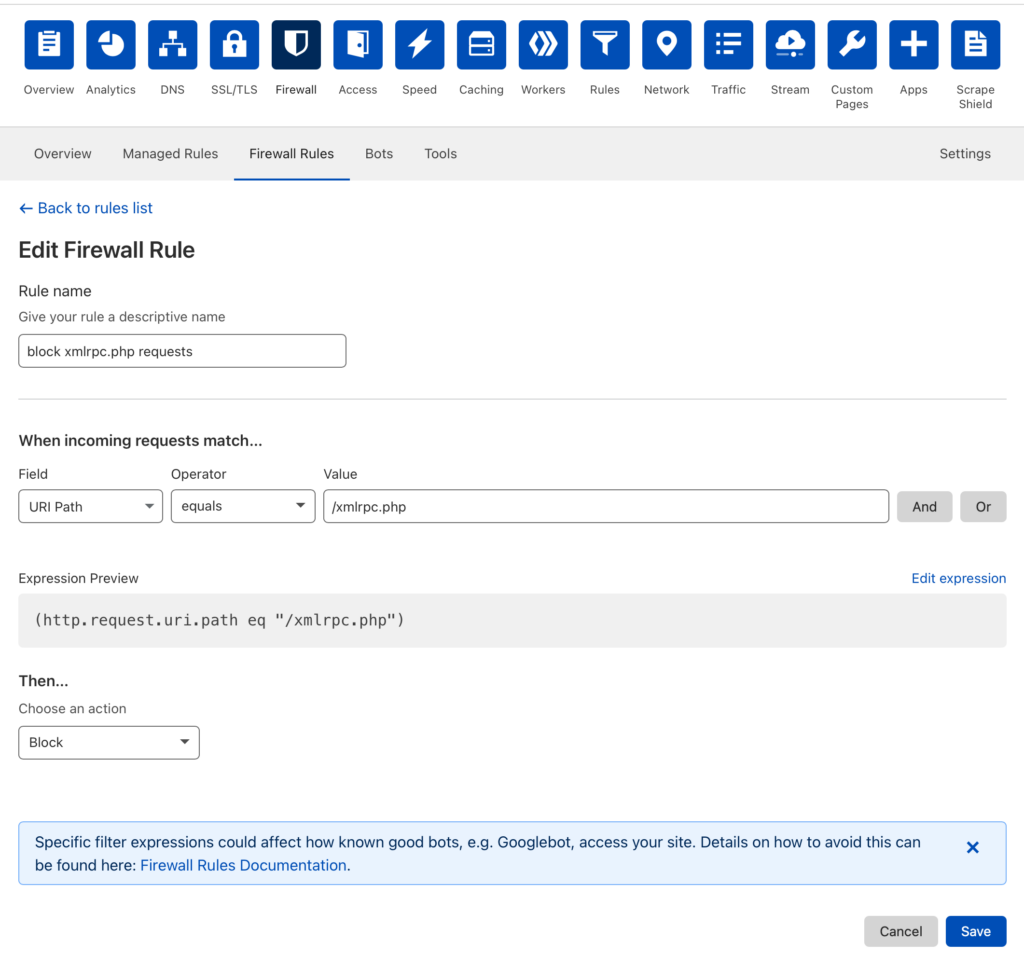
Login to Cloudflare and select the Domain for which you want to create a firewall rule. Then click on the “Firewall” tab (see image above). In our case we wanted to block requests to the /xmlrpc.php, so our rule looked like this:
Now back to the magic of New Relic. The observability culture shapes development and devops in powerful ways. We were able to identify a signal indicating that the server was handling traffic that was nefarious and took resources away from legitimate users. We made a hypothesis about what we wanted to try and do to positively impact that signal.
Since we started with observability, we have the ability to evaluate the work we did and determine if we were successful or not and if more work is needed. Take a look at this chart:
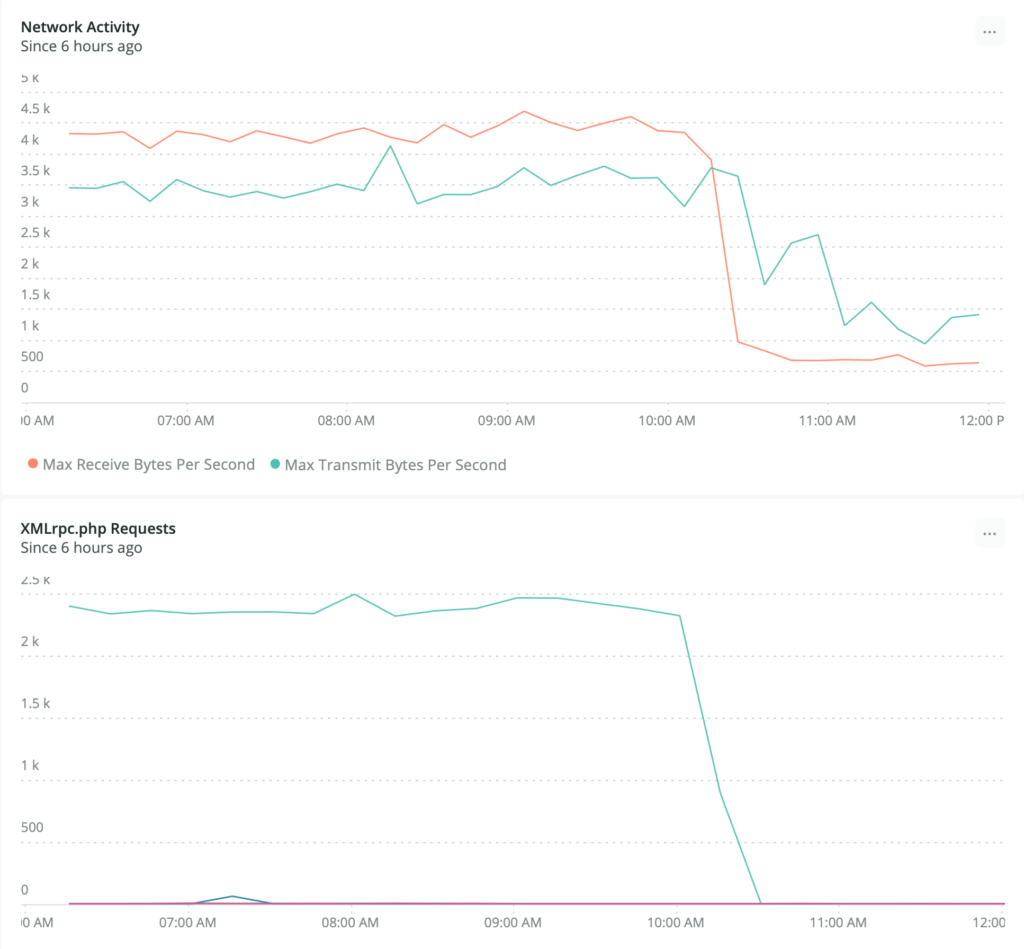
/xmlrpc.phpAny guesses about what time we turned on the firewall rule?
Both charts are time series looking at 15 minute increments of requests over the six hours prior to taking the screen shot. The bottom chart for xmlrpc.php requests is generated with this query:
FROM Transaction SELECT count(*) WHERE request.uri LIKE '%xmlrpc.php%' TIMESERIES LIMIT MAX FACET request.headers.host Since 6 hours ago
We effectively cut out unnecessary and nefarious incoming network requests that were coming in at a rate of close to 16-20k per hour.